27 Insightful Ecommerce Statistics You Need To Know
If you click to purchase a product or service based on our independent recommendations and impartial reviews, we may receive a commission. Learn more
If you’re thinking of starting an online business, or have been managing your ecommerce site for years, it’s vital that you have a firm grasp of the latest ecommerce trends and conversations so you can make the best decisions possible for your business. Those who enter the choppy seas of ecommerce can often find their boat capsizing if they haven’t charted the route before by checking the latest trends and statistics.
But people are busy! Who has time to market research when you’re trying to run an online business? Well, don’t fret, because we have researched extensively to bring you this comprehensive list of the most insightful and crucial ecommerce statistics. We’ll be covering statistics from all corners, everything from mobile ecommerce and consumer behavior to social media, as well as the top five ecommerce you need to know this year.
So whether you’re a newbie or a seasoned pro, these are the 27 insightful ecommerce statistics you need to know!
Top 6 Ecommerce Statistics
2. By 2025, online retail sales worldwide are projected to surpass $7.4 trillion
3. In just the USA, there were roughly 300 million online shoppers in 2023
4. 81% of people research online before making big purchases
5. The average cart abandonment rate is above 70%
6. Ecommerce makes up 22% of global retail sales in 2023
General Ecommerce Statistics
Now that we know the landscape of what ecommerce looks like, we can see there’s a lot of potential profit to be made. But there’s also fierce competition – between 12 and 24 million ecommerce sites are vying for customer attention already.
The only way you can stay ahead is to know what the key trends are so you can better navigate your business. These stats are relevant for all online retailers, so you can use them how you want and guide your business to ecommerce success.
7. Ecommerce Sales Are Projected to Reach $6.8 trillion in 2024
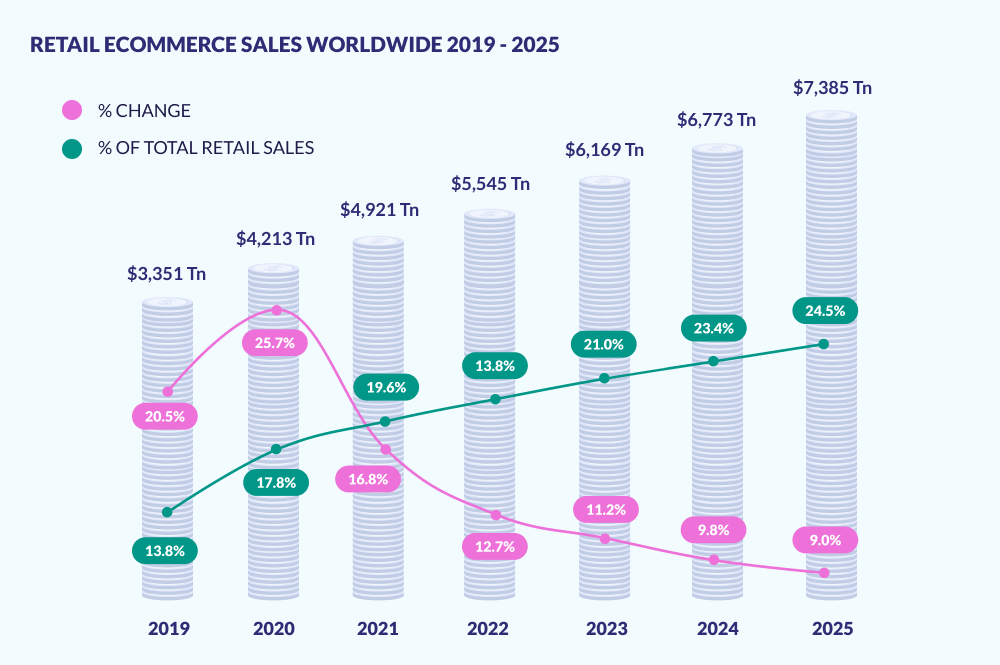
$7.4 trillion doesn’t even sound like an actual number, does it? Keep in mind this is the total collective sales, but even so, there’s a yearly global revenue increase of $600-$900 billion. But as you can see, the % change between years takes a massive dip after 2020 from 25.7% to 16.8%. Why is that the case? Well, a certain pandemic hit and forced many people to begin shopping online from inside their homes.
Global retail ecommerce increased by 24.6% during 2020 alone, and as you can see the revenue hasn’t slowed down. It seems people now prefer to do their shopping online. If there was ever a time to open an ecommerce store, it’s now.
8. By the year 2040, it’s estimated that 95% of all purchases will be through ecommerce
45.5% of Americans say they prefer online shopping to in-person retail, and this figure is only expected to increase year on year. For many, the convenience of not having to go searching or find an item and the time it saves is a major tick in ecommerce’s corner.
Revenue hasn’t slowed with ecommerce since the pandemic, and it’s clear that ecommerce isn’t just a trend and is in fact here to stay. So why wait until 95% of all shopping is done online when you could get on the ground floor now before the competition gets worse?
9. About 27% out of 7.7 billion of the world’s population shop online
27% of 7.7 billion may not sound like a lot, but do some quick maths and we can deduce that’s still 2.08 billion people! That’s 2.08 billion potential customers!
With that amount of customers, there’s certainly enough to earn a decent profit online with even the most obscure product. This online store sells “Realistic Werewolf Dolls”, so even if you don’t think so, trust that there will always be a market for anything, especially online. You just need to find your target market!
10. In 2024, an estimated 2.71 billion consumers will have completed at least one purchase online
Given the popularity and convenience of online shopping, it’s only to be expected that people will be looking to shop online more and more. These kinds of figures only serve to further underline how important ecommerce is to new and existing brands.
11. Amazon was the largest online retailer in 2022
This is a rather unsurprising result but Amazon is the largest online retailer, earning $502.2 billion in 2022 alone.
Amazon has held a tight grip on online retail for decades now by being a platform for other sellers to sell their products. However, here at Website Builder Guide we always recommend building your own website for a sense of ownership and control of your store.
Global Ecommerce Statistics
Ecommerce isn’t just confined to the US – online shopping is a worldwide phenomenon. This means that not only can consumers purchase products from anywhere on the globe, but it also means that businesses can target international audiences, too.
12. The global ecommerce market is predicted to hit $6.3 trillion in 2023
Given the growing popularity of online sales, this figure isn’t surprising. Selling online is no longer a “nice-to-have” – for most retailers, it’s a necessity. Especially given that by 2024, it’s estimated that 21.2% of total retail sales will happen online.
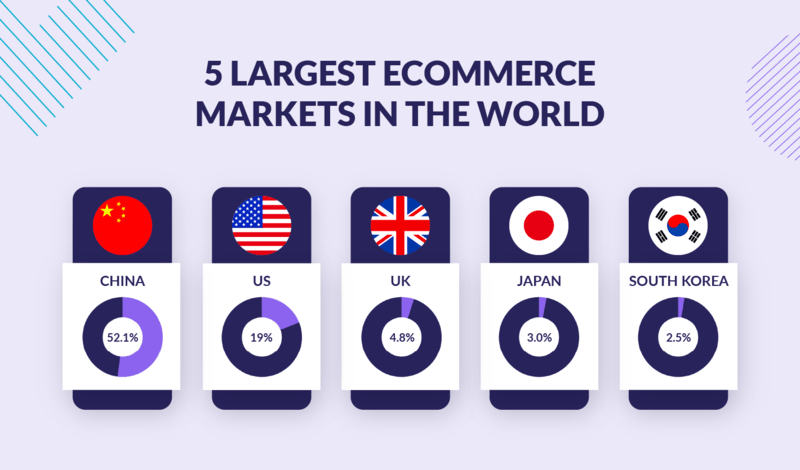
13. China, the U.S., and the UK are the top three ecommerce markets globally
China tops the chart, claiming 52.1% of the worldwide retail ecommerce sales share. The U.S. and the UK take second and third place with 19% and 4.8% respectively. They’re followed by Japan in fourth place with 3% and South Korea in fifth with 2.5%.
14. Argentina experienced the fastest ecommerce growth in 2020 with a 100.6% increase in online sales
Beating both Canada and the UK, Argentina’s online sales rocketed during 2020. This is impressive, not least because Argentina is only roughly a third of the size of the United States and has a population of just under 46 million.
Overall, Latin American ecommerce sales saw a 22.4% increase in ecommerce sales in 2022, totalling $104 billion.
Mobile Ecommerce Statistics
15. Mobile ecommerce US sales are projected to reach $728.28 billion by 2025. This will account for 2% of retail ecommerce sales in the US
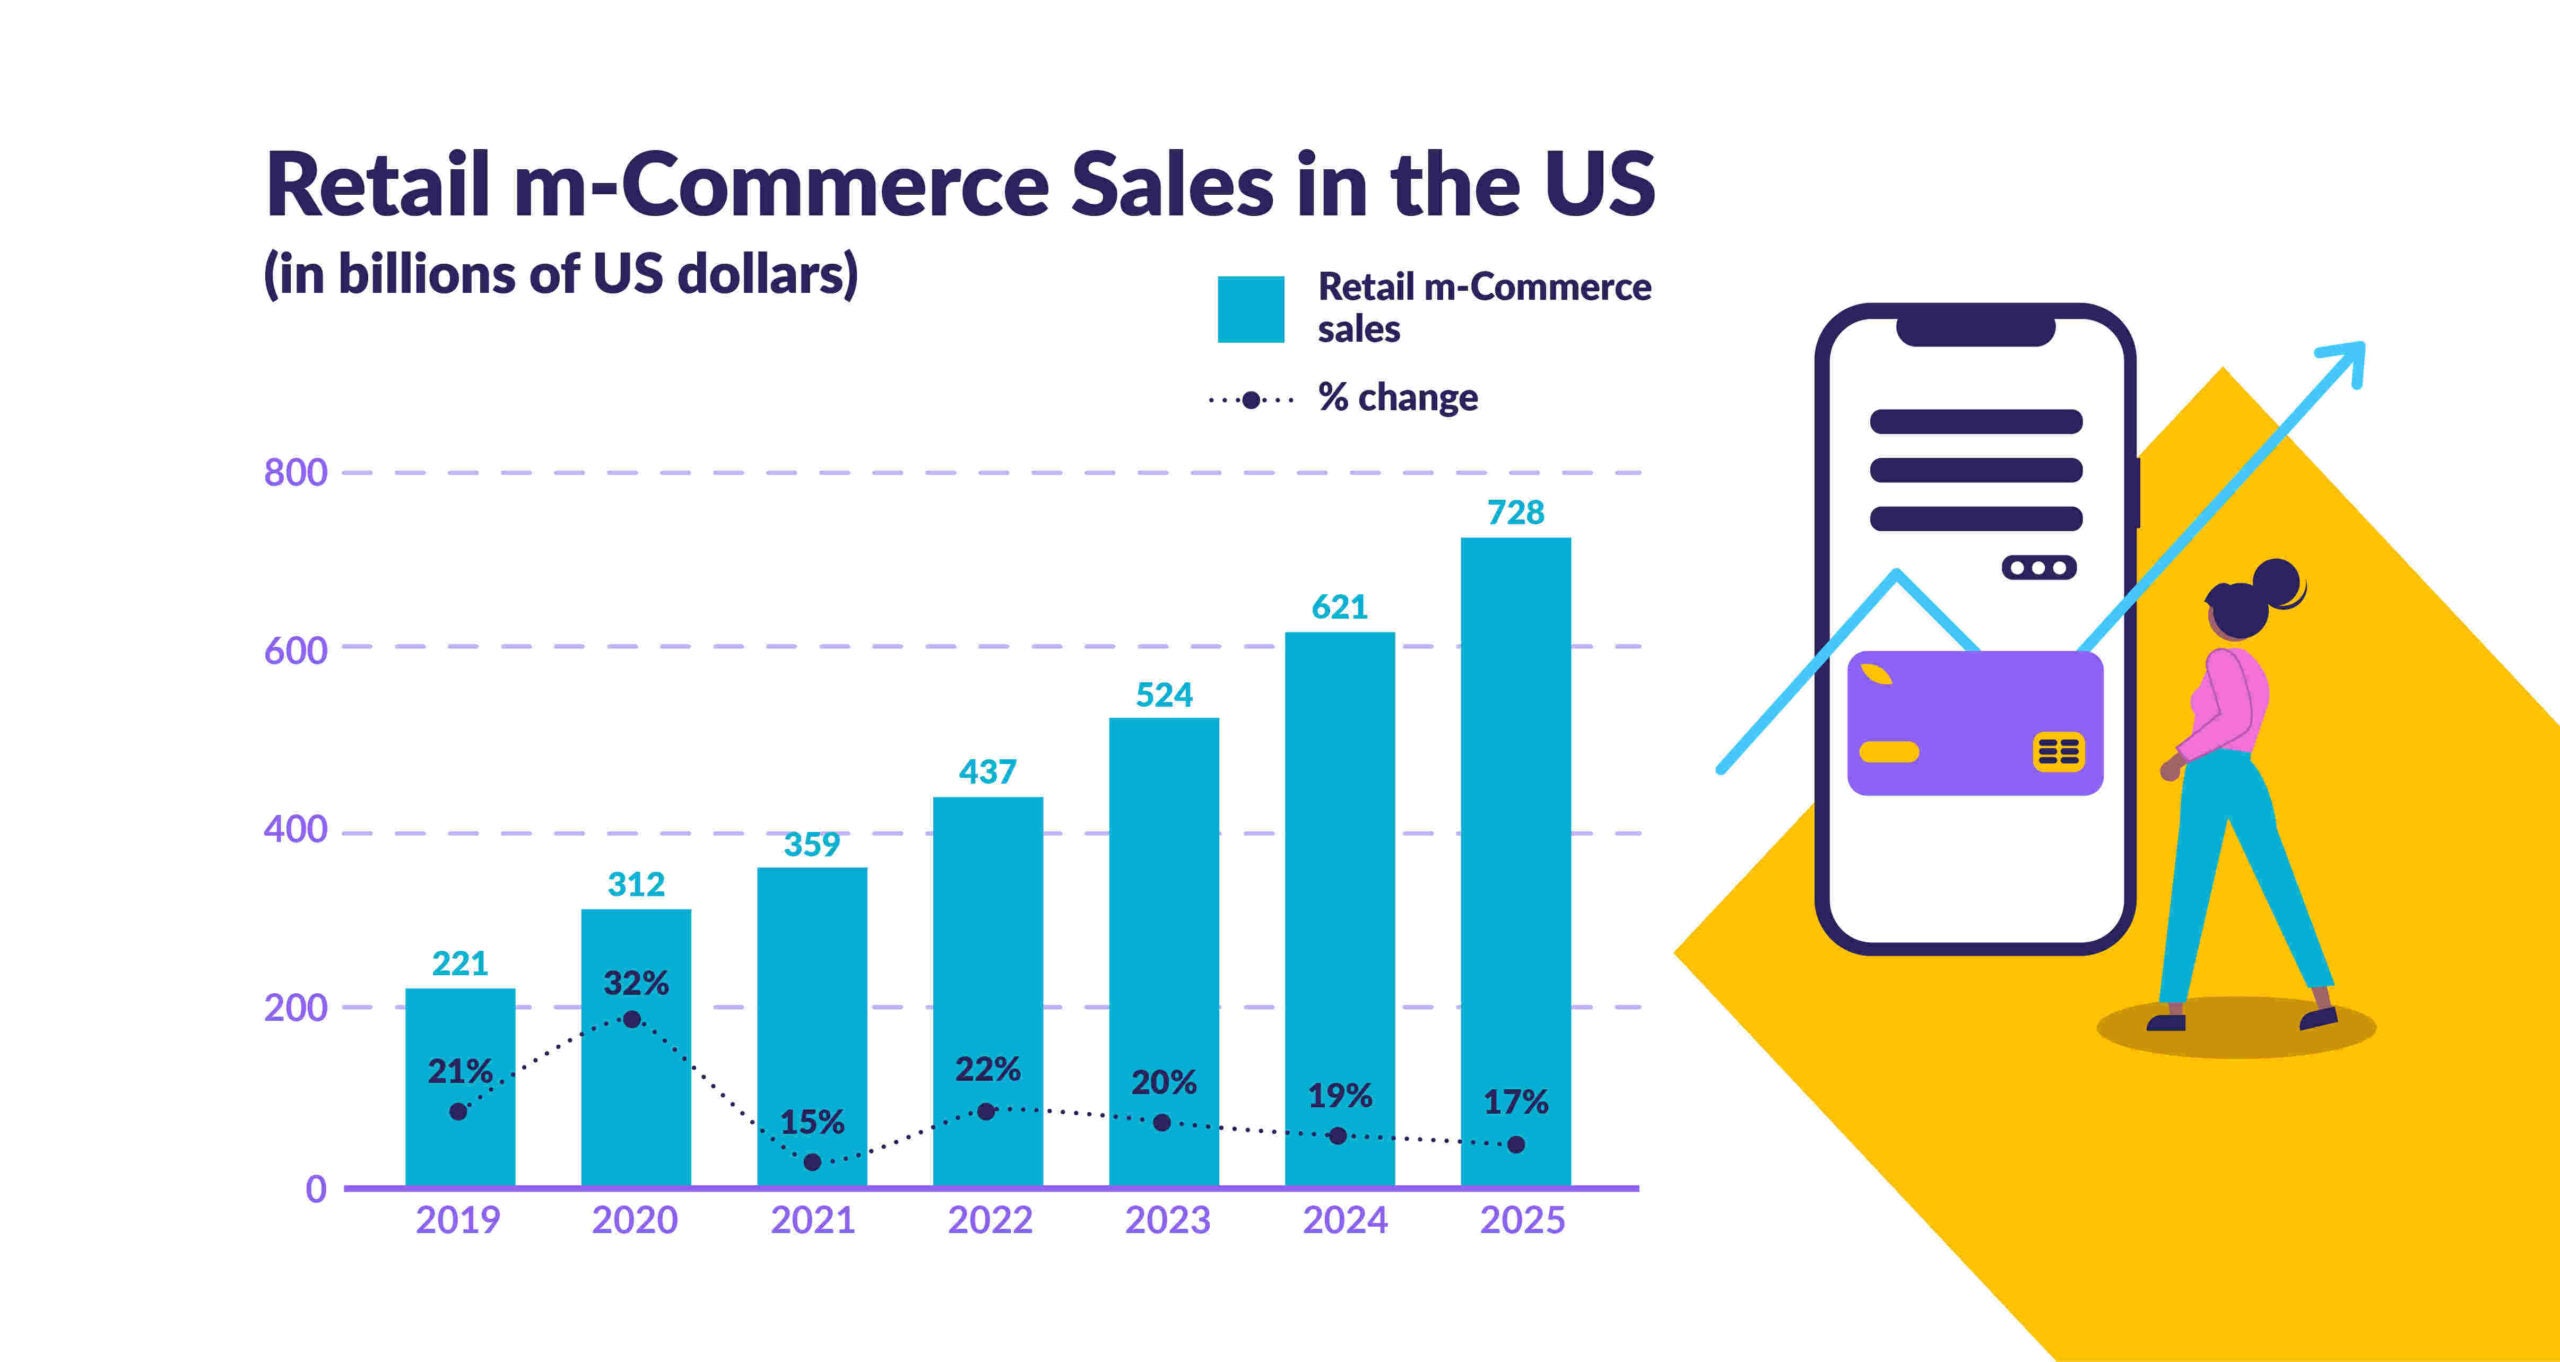
Mobile ecommerce (or m-commerce) is projected to grow exponentially over the next few years. More and more people will be given access to phones which they can use to make online store purchases through apps.
The most popular mobile shopping app in 2021 in the US was the Walmart Shopping and Grocery app, with nearly 25 billion user sessions recorded. Once people trust your store, they are more likely to keep returning and continue to make purchases, especially if it’s only an app away.
16. Conversion rates from mobile apps are 3x higher than mobile websites
Once a customer has been to your store, chosen a product, and been through checkout, they have been “converted”. All the methods you as a business owner use to encourage a purchase, such as pictures, sales, and coupons – everything in your storefront really – has a “conversion rate” of how effective it was at converting a customer to make a sale.
Mobile apps have a higher conversion rate than mobile websites due to their customers already being further down the marketing funnel. By downloading the mobile app and having it constantly on their phone, they are already in the “consideration phase”.
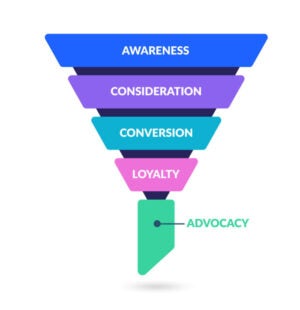
If you want to increase your conversion rates, creating a mobile app gives your customers a way to have your products always close at hand.
17. 28% of US shoppers use cell phones while in a physical store to look up discounts, compare prices, and read product reviews
If m-commerce wasn’t successful enough on its own, then it seems like many customers would still use their cell phones while in a physical store! There are currently 6.8 billion smartphone owners in the world right now. That’s a 4.2% annual increase and 84% of the entire global population, currently estimated at 8.1 billion people.
Run from it… dread it… it doesn’t matter. Smartphones, and by extension m-commerce, are here to stay. Simply think of how much time you spend on a smartphone. Maybe you’re viewing this article on one right now?
The ability to stay informed while also lessening the time spent on purchasing decisions is a trend that’s unlikely to go away. As an online store owner, it’s best for you to make sure your store is as consumer-friendly and accessible as possible, both through mobile devices and computer screens.
Ecommerce Statistics for Social Media
There are six social media sites with over 1 billion monthly active users – Facebook, YouTube, WhatsApp, Instagram, Wechat, TikTok. Many of these platforms now have dedicated marketing platforms that users can buy and sell through, such as Instagram Shopping or Facebook Marketplace. If your online store has no presence on any of these platforms, you are missing out on a lot of eyes on your products and letting the competition get ahead.
As we saw before, 28% of shoppers will still use their phone in a physical store to look up more information, and they’ll more than likely see your social media. It is the first stop for many potential customers, so you have to ensure it is well-maintained and updated often. Let’s look at some social media ecommerce stats to show you the potential.
18. 59% of the world’s population uses social media. The average daily usage is 2 hours and 29 minutes
Let’s do some more math. 59% of the population is nearly 5 billion people, and with 2 hours and 29 minutes being the average daily usage, that’s nearly 12 billion hours being spent on social media a day!
With so much time being spent on social media a day, think about how many eyes could be on your business if you started advertising and selling on there earnestly.
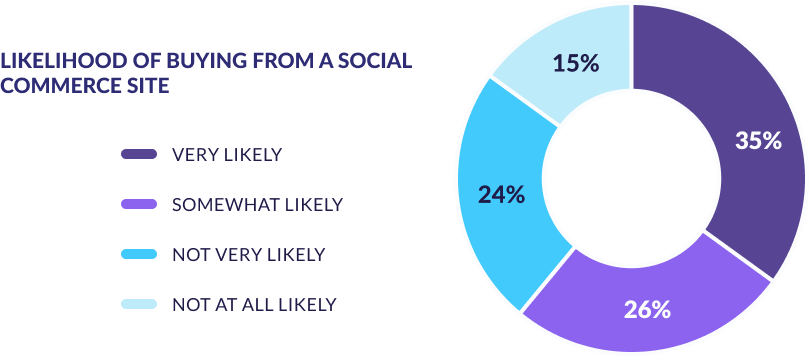
19. According to a Kantar-Catalyst report, over a third of online consumers (35%) stated that they are “very likely” to use social commerce to make a purchase, with another 26% “somewhat likely”, totaling 61% in favor of it.
Social media can sometimes be seen as a tricky platform to sell through, due to its more personalized nature. If having an online store is akin to having a real, brick-and-mortar store, then social media is like coming up to someone on the street and trying to sell them something.
86% of consumers prefer a more personable and transparent brand on social media and are therefore more likely to make a purchase.
20. Social commerce sales are projected to rise by 26% to $1.2 trillion by 2025
Due to the more, well, social side of social media ecommerce, consumers are either very willing to engage with brands and make purchases or are militantly against the presence of brands that they see as invading their online spaces.
While there will always be detractors, it seems social media ecommerce shows no signs of slowing down, with a projected 26% rise by 2025.
21. 71% of consumers who have had a positive experience with a brand on social media are likely to recommend the brand to their friends and family
While there will be brand critical types on any social media platform, a positive brand experience will result in a recommendation to family and friends.
This will usually mean that you as a brand are transparent and honest, that you commit to social responsibility, show an active interest in social causes, and also go above and beyond helping customers.
22. 75% of internet users use social media to research products
A key thing to realize going forward is that the immovable giants of search engines are being outpaced by social media users who, not wanting to have to change apps, would rather search for things on social media.
In a new ad, video-sharing site TikTok shows off its search functionality which has ended Google’s 15-year streak as top dog. While you should never stop trying to optimize your SEO, diversifying into new search fields and methods is likely to help you stay ahead of the curve.
Ecommerce Consumer Behavior Statistics
The user experience of your consumers is paramount to a sale, especially online where leaving without purchase has never been easier. 88% of visitors online are less likely to return if they have a bad experience on your site, so knowing their needs and buying habits means it’ll be even easier to turn them into return customers.
23. Around 25% of the world’s population shops online, but in our own research we can report that the average cart abandonment rate is above 70%
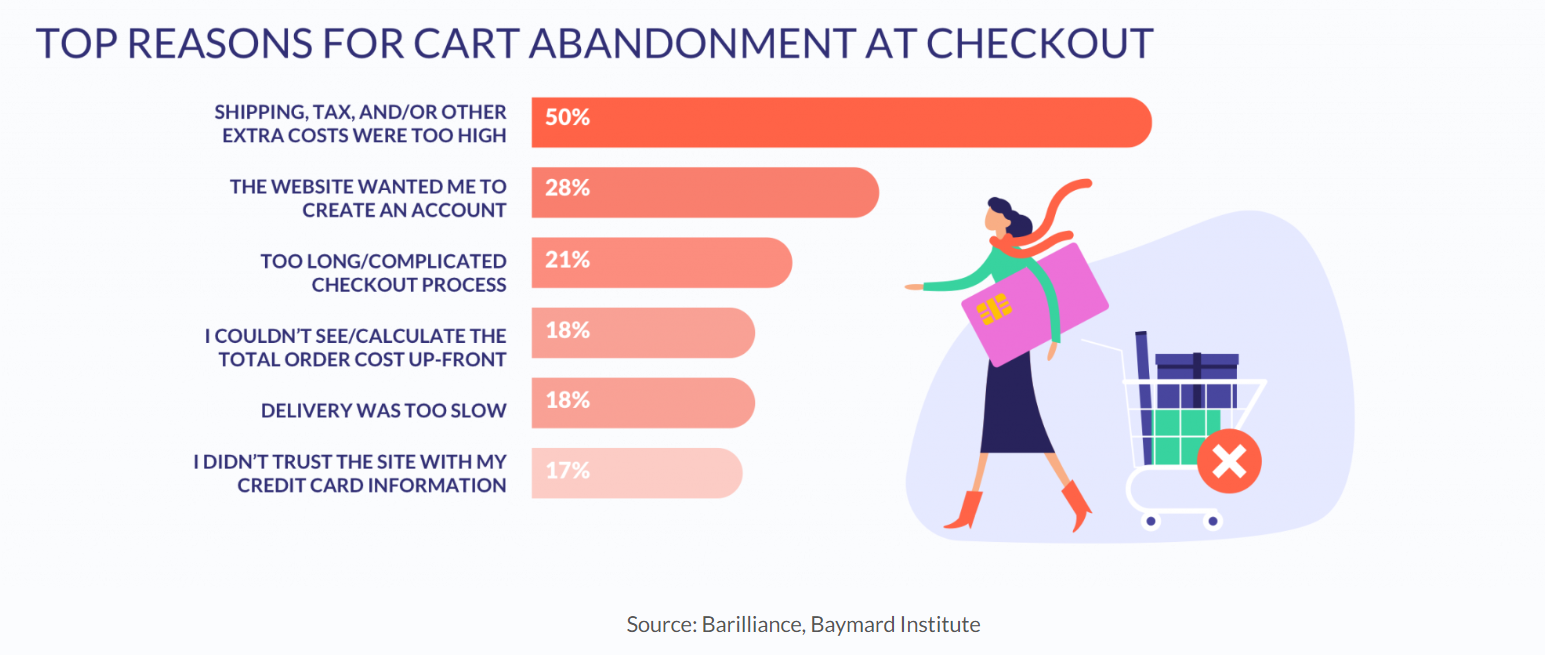
One of the major plagues of online ecommerce is conversion rates and cart abandonment. Entering a physical store and filling up a cart with products would suggest to everyone, including the owner, that you intend to follow through with a purchase. Online, this is not the case, as under the anonymity of the internet you can change your mind whenever you like.
But by understanding behavior, you can make changes to your site to reduce cart abandonment and get a conversion. Hidden fees, how much time is taken to checkout, and the poor website design are all contributing factors to a customer abandoning a cart.
24. 85% of consumers research a company online before they decide whether to make a purchase
Because so many consumers research a company before they make a purchase, it’s best to provide as much information as possible on your site so the consumer can place their trust in you.
More than $2.3 billion was lost in 2021 due to online scammers, so consumers have a right to be wary of sites they don’t trust. That’s why you must do your best at being as honest as possible about every step of the journey, communicating and responding to all customer reviews, and making sure your contact info is updated and easy to find.
25. 61% of online consumers in the United States have made a purchase based on recommendations from a blog
Additionally, it’s important not to underestimate the power of blogs when it comes to online ecommerce. In many ways, shopping still hasn’t evolved from the markets of old as word-of-mouth is a very powerful tool when it comes to getting your store seen.
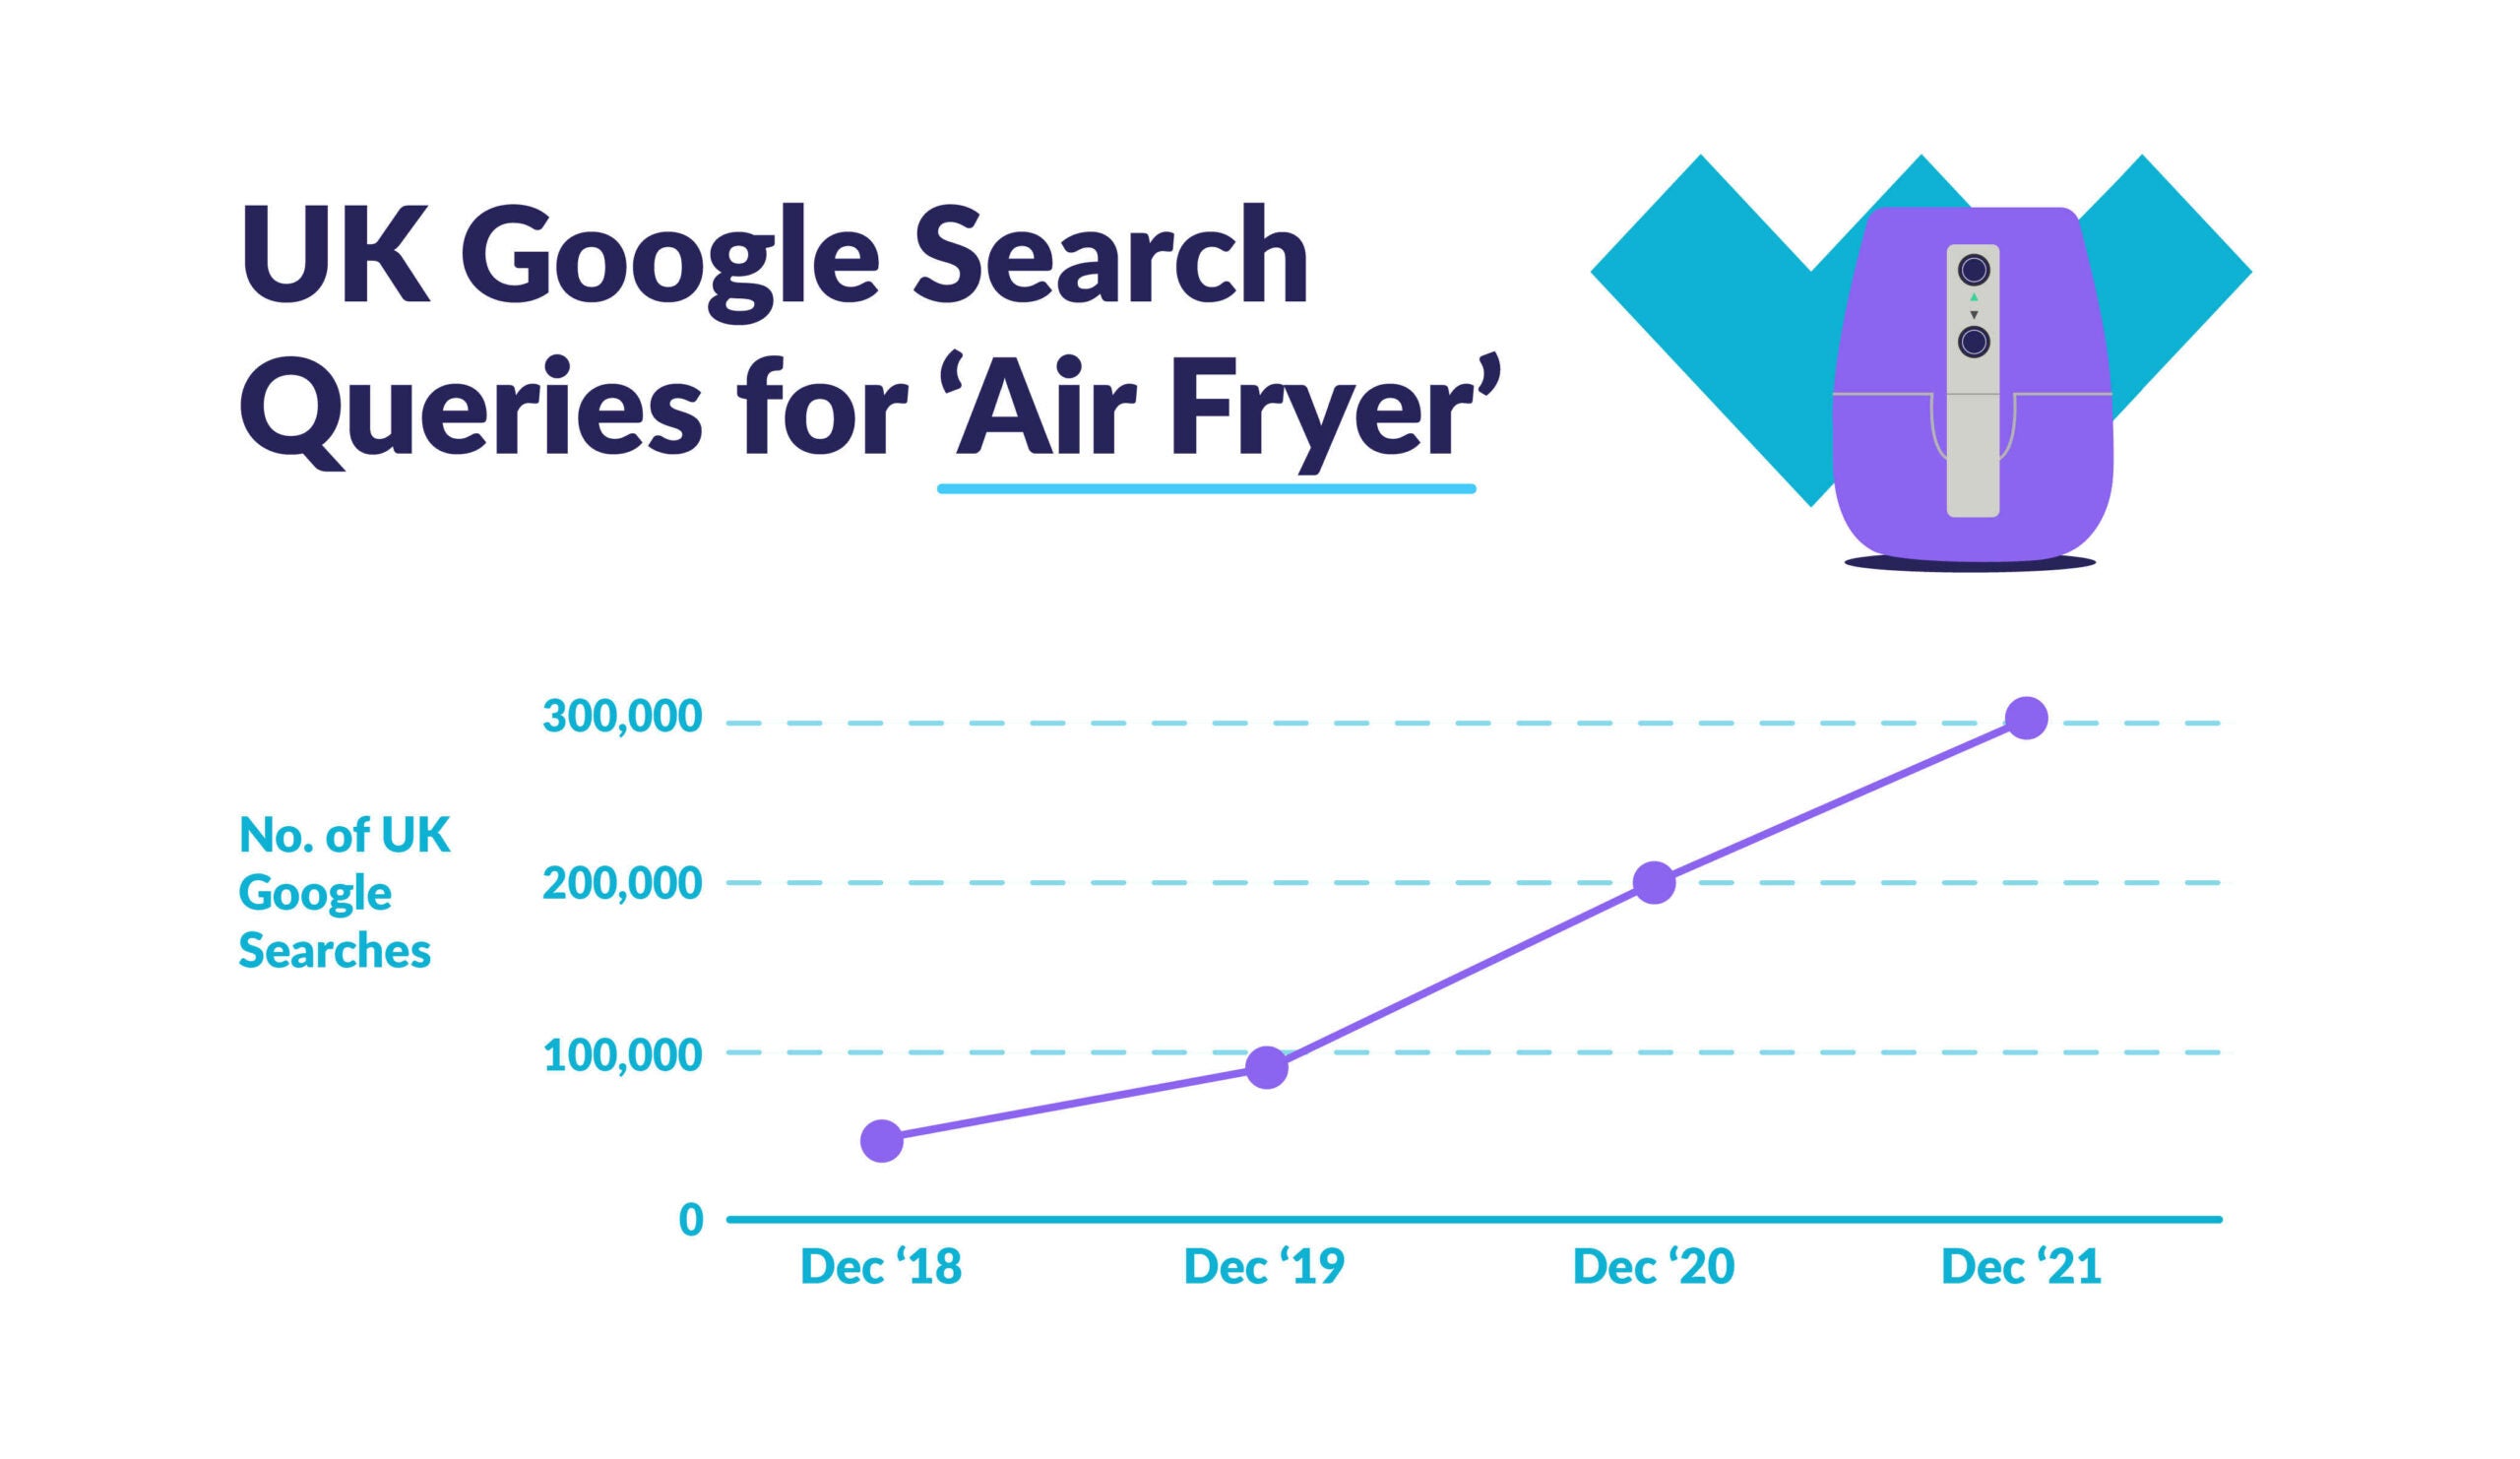

Niche kitchen appliances such as air fryers have sales up 3,000% due to word-of-mouth and recommendations from the internet, showing just the power that a recommendation on the internet can have.
26. Up to 70% of US consumers are no longer concerned about shopping in-store
Let’s face it, having to shop in person all the time was a real pain. You had to plan it beforehand, you had to drive there, and then sometimes they’d be out of what you came for. The internet has made shopping a much easier activity.
As an online retailer, it’s your duty to make a consumer’s shopping experience as easy as possible. Businesses can lose up to 35% of their sales if their user experience is poor. Hard-to-read text, ugly buttons, jarring color schemes, bad layout, and just a general lack of clear communication can all damper the user’s experience, so make sure you iron out all the bumps in the road before going live.
27. 87% percent of shoppers begin product searches on digital channels
As we mentioned, no one likes having to walk around a store to find the one thing they were looking for, only to see it’s not there. Your average ecommerce store’s product page has so much more information at the user’s disposal that it’s no wonder 87% of shoppers turn to digital channels for information on products.
That’s why, as a store owner, this information has to be as clear as possible. Remember, there are between 12 and 24 million ecommerce sites currently live. If a consumer can’t find the information they want on your site, they will look somewhere else, and most likely make the purchase there instead.
Increase of Ecommerce Fraud and Scams
Of course, with the increase of ecommerce fraud comes the enhanced risk of ecommerce fraudsters – something the data attests to.
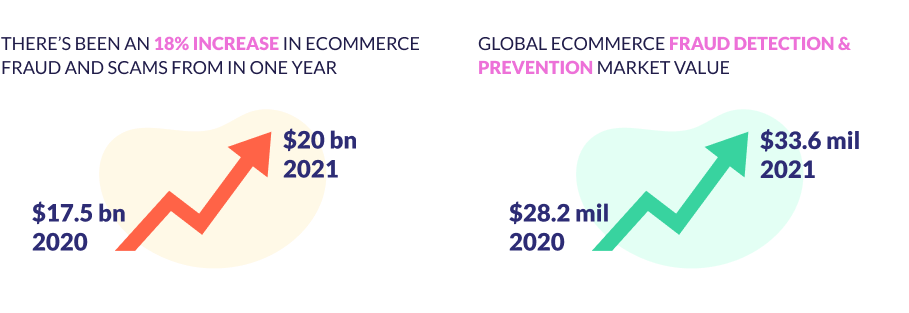
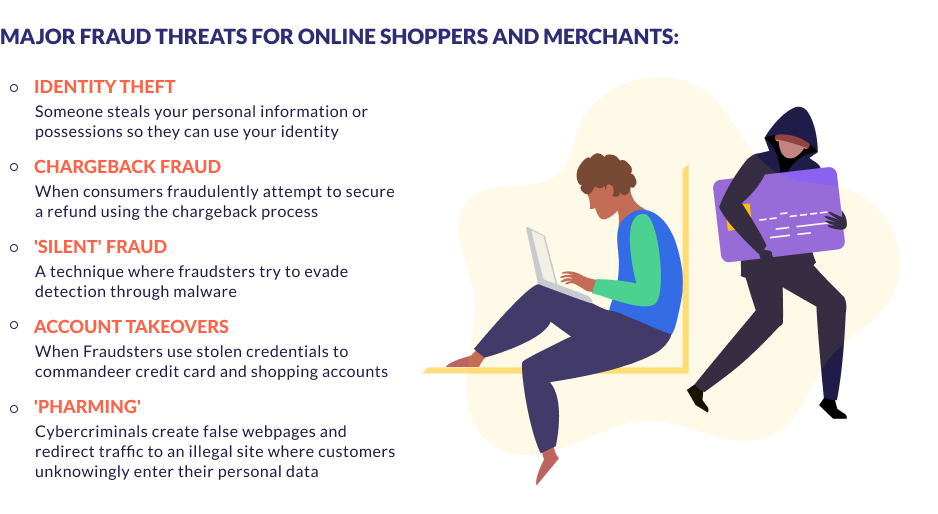
Among the major drivers of this uptick in online scamming are chargeback fraud (also known as ‘friendly fraud’), identity theft, and ‘silent’ fraud. ‘Pharming’ – a type of cyberattack which attempts to redirect a website’s traffic to a fake site by uploading malicious code to a device – is also prominent, as are account takeovers.
Of the world’s ecommerce fraud markets, China’s is the most burgeoning. While this doesn’t come as too much of a surprise – at $672 billion per year, the country’s ecommerce market is the globe’s largest – the figures are certainly still alarming. China is expected to account for more than 40% of the world’s ecommerce fraud losses by 2025, at a total surpassing $12 billion.
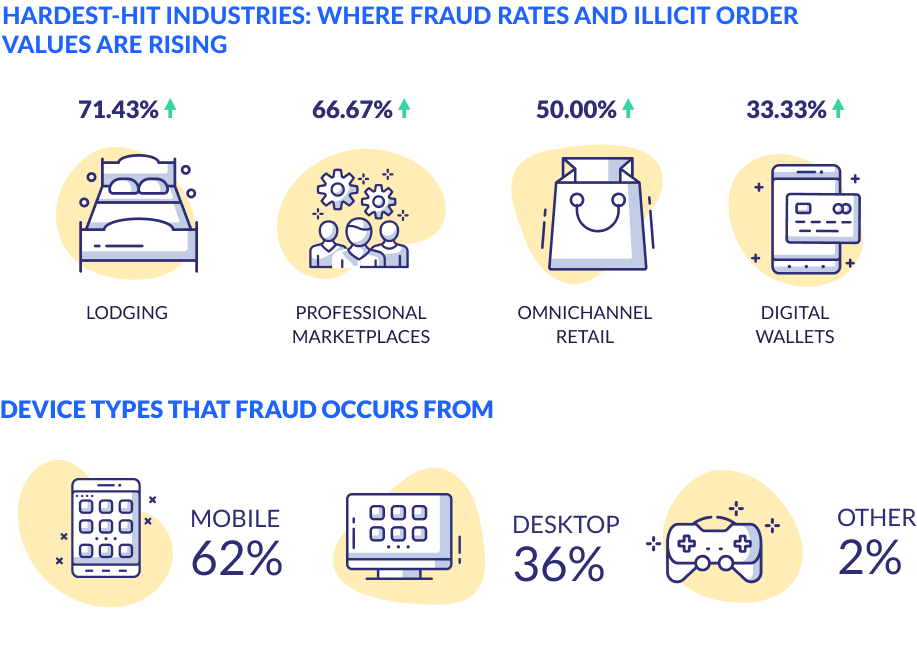
It’s fair to say, then, that fraud is everywhere. But which industries are hardest hit – and which devices are thieves most likely to use to commit fraud?
Summary
These statistics have been presented here for you to be able to craft a workable plan for your online store to succeed. The rapid expansion of ecommerce has been staggering, and the market is full to brim with competition.
Think of it like being a fisherman on a choppy sea. You know there are great shoals of fish underneath the water, but you don’t know where to cast your net to catch them. With our statistics, we’ve given you the most accurate way to predict where the fish could be.
With a recession seemingly looming on the horizon, ecommerce website owners will have to adjust to make it through. The best advice we can give is to understand where the market is heading and know your target audience. Once you can cultivate a loyal consumer base, you will still be able to carve yourself a sizable niche and hopefully thrive and succeed on the online waters!
Now comes a bit of faith on your behalf, but here at Website Builder Guide we believe in you all the way!


2 comments